Get a birds eye view of WP_HTTP usage in WordPress website with Summary Cards. It is calculated using the latest 100 external requests. WP_HTTP requests recorded using HTTP Requests Manager plugin.
Let’s see what each card shows and means.
More WP_HTTP videos in the playlist.
What does each WP_HTTP summary card mean?
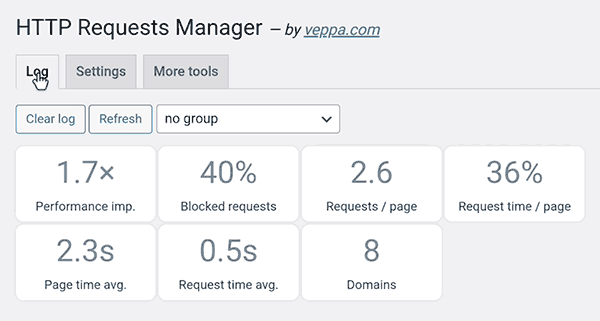
HTTP Requests Manager plugin page shows summary of latest 100 WP_HTTP requests.
View summary cards by navigating to “Tools” → “HTTP Requests Manager” page in WordPress admin area.
You need to install and use the plugin for some time in order to record some WP_HTTP requests.
When you have multiple pages of WP_HTTP logs you can navigate to other pages of the report and summary cards will be updated accordingly.
What does each summary card show?
Card 1: Performance improvement
This card shows how much performance improvement gained by optimizing WP_HTTP request usage.
It is easy to acknowledge performance gain when you see a number like “2x”. Which means doubled.
In this report it shows 1.7x performance improvement. So our website is 1.7 times faster because we blocked some WP_HTTP requests.
It is calculated by using the number of blocked and not blocked requests. You will see a higher number when more requests are blocked.
In case no optimization is made (no requests blocked) you will see “-” in this card.
Calculation formula: Total requests / Passed requests.
Card 2: Blocked requests
This card shows the percentage of blocked requests. In the current report it shows that 40% of requests are blocked.
Calculation formula: Blocked requests x 100 / Total requests.
Card 3: Request / page
Shows average number of requests per page. When more requests per page you have then slower your pages will be. In the current report it is 2.6 requests per page. Which is normal.
Calculation formula: Requests / Pages.
Card 4: Request time / page
This card shows how much time in percentage requests use from the total page time. Higher percentage (more than 50%) means requests are really slowing down your wordpress pages.
Calculation formula: Total request time / Total page time
Card 5: Page time average
Card shows average page time. Lover value means a faster website. In the current report it is 2.3 seconds. Which is OK.
Occasionally you may see really high numbers here like 30 or even 150 seconds. Do not worry because it is calculated using logs visible on the selected page. Not all records. So if the last 100 records are from a single cron job and that cron job ran for 30 seconds you will see 30 in this card. But on other pages this number will be more reasonable like 3-5 seconds.
Check how cron job with pingback and enclosure checks took 149 seconds.
Calculation formula: Total page time / number of pages.
Card 6: Request time average
This card shows how much time it took to load a request on average. In the current report it is 0.5 seconds which is good value.
Remember that you cannot control this value because it depends on the network and response speed of the remote server.
Calculation formula: Total request time / number of not blocked requests.
Card 7: Domains
This card shows the number of domains where a WP_HTTP request was sent. Current screenshot shows that requests were made to 8 different domains (and subdomains).
You can view names of those domains by grouping requests by domain using the dropdown above summary cards.
Calculation formula: Count number of distinct domains (and subdomains).
Conclusion
WP_HTTP usage and optimization summary cards are good for having general view. Most useful card is “Performance improvement”. Having bigger than 1.2x there means that you are optimizing WP_HTTP usage on your website.
Blocking useless requests saves resources of your web server and keeps the WordPress website fast.
What is next:
- Learn how performance improvement is gained by optimizing WP_HTTP usage.
- Optimize more by blocking useless WP_HTTP requests.
- Get free HTTP Requests Manager plugin.