Looker Studio template to view top pages by traffic sources for measuring your marketing efforts.
- Simple (one page) report to show traffic source and page view relation.
- GA4 is complicated. This report focuses on what matters most. Easy to narrow down by page or traffic source.
- View page views and average session duration.
Additionally in this video I show how to copy report and view your own Analytics GA4 report.
Instructions
Steps to copy and use report:
- Open free template (get template here). Then click ⁝ (three dots) menu button at the top right corner.
- Click “Make a Copy” from dropdown menu navigation.
- On opened page choose your own analytics data source.
After this you can view your own Google Analytics 4 data in this Google Looker Studio template. You can also change report charts and tables to meet your own needs.
Learn to add Google Analytics to WordPress using code snippet.
Overview of Top Pages Report
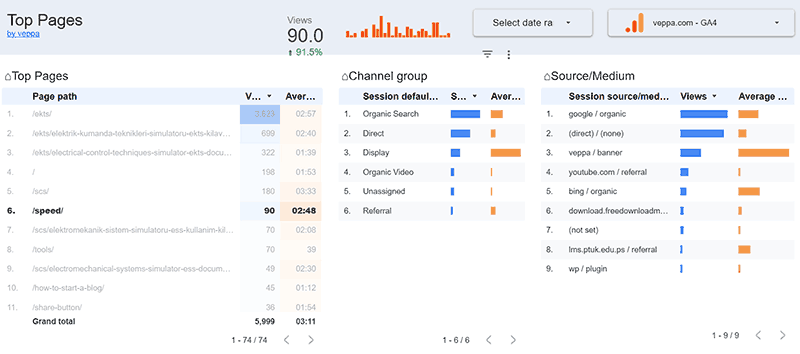
Top pages report shows 3 tables:
Each table is interactive. Click on any row in table to filter down analytics data.
Tables have “Pageview Count” and “Average Session Duration” columns. When used together they give complete picture about related row and ideas how to optimize related row.
Here is table that shows what combination means and how to improve it.
| Views | Duration | Meaning and action |
|---|---|---|
| High | High | Row performs very well. Your important pages should be here. |
| High | Low | Row does not meet user expectation. Fix content on this page or do not promote this content on related traffic channel ( “source/medium”) |
| Low | High | Page is under promoted. Try to promote these pages more in good performing traffic sources. |
| Low | Low | Page content and its promotion is poor. You need to fix both content quality and promotion. |
What are important pages?
Important pages are most valuable pages in your business. These pages where visitors make purchase, subscribe to newsletter, register an account, ask question, view webinar, download some file etc. Generally, they are pages where visitors give money or their contact details to you.
Every website has different important pages. In my case it is a lead magnet page. A page where visitors show interest to my downloadable file and give their email in order to get it.
Here are some use cases for each table in report.
How to use “Top pages” table?
- View top pages by pageviews for a website.
- Low value in “Average session duration” column will help to identify pages with low engagement. These pages do not meet user expectations. Fix them by adding relevant engaging content.
- Pages with low pageview and high session duration underpromoted. Promote these pages more on traffic sources that perform well for them.
- Click on page Path to view traffic channels (session source/medium) that send traffic to it.
How to use “Channel group” table?
- Click on Channel group row to view related “source/medium” and top performing pages.
- Common channel groups:
- Organic search: view individual search engines that send traffic to you.
- Direct: high direct visitors mean your website has high brand value.
- Display: compare different banners and focus on best performing ones. Try to optimize banners that do not perform well.
- Organic Social: view list of social media sites that has audience interested in your content. Create and share more content there.
- Organic video: These are people who trust you most. They are familiar with your content and your offer. They are more likely to become your customer in near future. Try to show your important (lead magnet, purchase) pages to them.
- Referral: View list of domains that send traffic to your website in “Source/medium” table.
How to use “Source/Medium” table?
- Click on source/medium row to see most viewed pages by traffic source.
- Check how performs source/medium that you created manually. For example: individual banners, share buttons, links in email marketing.
How to tag links for appearing in desired Channel Group?
Use specific source/medium parameters to appear in desired “Channel group”. View “Channel for manual traffic” section in related google help document.
Source and medium parameters should be added to URL for tracking.
?utm_source=top&utm_medium=banner
Here are parameters for common channel groups:
- Display: Medium is one of (“display”, “banner”, “expandable”, “interstitial”, “cpm”)
- Paid Other: Medium matches regex
^(.*cp.*|ppc|retargeting|paid.*)$ - Email: Source =
email|e-mail|e_mail|e mailOR Medium =email|e-mail|e_mail|e mail - Organic Social: Medium is one of (“social”, “social-network”, “social-media”, “sm”, “social network”, “social media”)
I use utm_medium=social for my sharing button so traffic from shared content appears in “Organic Social” channel.
And utm_medium=display for the after content CTA.
Get Top Pages Looker Studio Template here →
What is next:
- Get share button code that uses
share/socialsource and medium variables. You can view returned traffic using current Looker Studio template. (I demonstrated it in video above) - Add Google Analytics (using code snippet) without slowing down your WordPress.
- Improve page loading speed of a WordPress website. See how I get 100 PageSpeed score.