View comparison video on Youtube.
More HTTP Requests Manager videos can be watched in Youtube playlist.
When it comes to debugging WordPress there are not many plugins available. This article compares 2 plugins Query Monitor and HTTP Requests Manager.
You will learn whether they are competing or complementing each other. Their differences, working principles and information that can be gained using each plugin.
Before we start comparing them here is short description for each plugin:
Query Monitor:
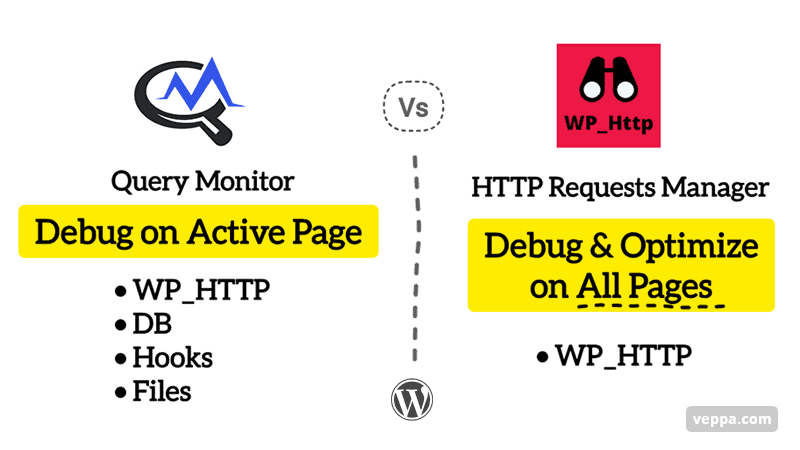
WordPress developer tool for debugging database queries, grouping queries by plugins, PHP errors, WP_HTTP usage, hook usage, page asset (js, css) usage, theme files, user capabilities, memory and time usage. Query monitor shows debug information on the active page. Admin navigates to different pages to view live debug information about that page.
HTTP Requests Manager:
Logs all external requests performed using WP_HTTP inside WordPress. It works on all pages and records external requests when they happen. Recorded information contains time and memory usage, request and response data, function or plugin making external requests. Plugin keeps a log of the latest 1000 records so the admin can view and debug them when needed.
Table of Contents
Differences
Let’s start by looking at differences between these two plugins. We will look at detailed features later.
Query Monitor: covers most areas of WordPress components: DB, WP_HTTP, files, PHP errors, hooks.
HTTP Requests Manager: only covers WP_HTTP usage everywhere. Including pages where Query Monitor is not covering: inside cron job, ajax and rest api.
Main differences between Query Monitor and HTTP Requests Manager:
| Query Monitor | HTTP Requests Manager |
|---|---|
| Works on active page only | Works on all pages |
| Debugs database queries, WP_HTTP, files, hooks, PHP errors | Debugs WP_HTTP only |
| Does not work inside cron page | Works in cron page as well |
| No historical data | View recorded historical data |
| Cannot know about WP_HTTP external requests on page if not detected while you are browsing | Records WP_HTTP requests even if you personally have not visited that page |
| Debugs only | Optimizes WP_HTTP usage |
Features
Query Monitor Features
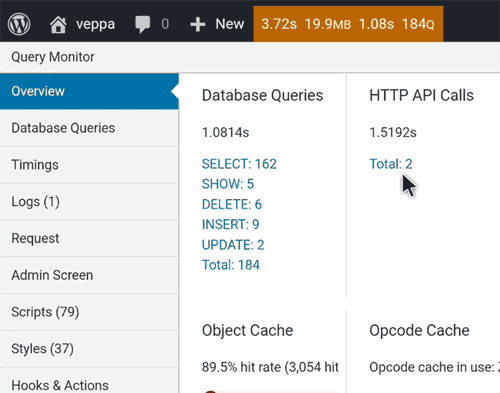
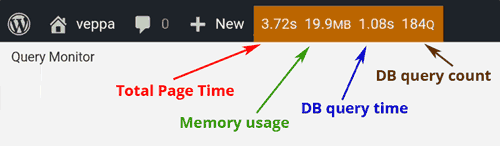
Overview of general resource usage on current page. It shows total page generation time, memory usage for generating the current page, number of database queries, number of HTTP API calls (WP_HTTP requests).
This view also shows that 2 WP_HTTP requests took 1.5 seconds. 184 MySQL requests took 1 seconds. Which means on average every WP_HTTP external request equals 140 internal MySQL requests.
In other words, when most users are worried about reducing MySQL database queries for optimization, not many users are concerned about reducing external WP_HTTP requests. By reducing one external requests you can gain performance improvement similar to reducing 140 MySQL queries.
Also external requests sometimes can be much slower like 10-30 seconds and then timeout.
Quick resource usage info on admin bar. This is useful as you navigate through WordPress website you can look at this bar and know if the page is fast or slow. On slow pages you can click on it and debug further to find problematic areas of the resource usage.
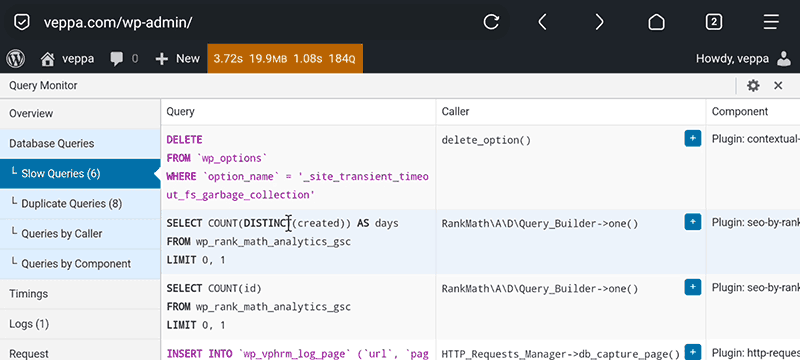
Strong area of the Query Monitor plugin is debugging database queries. It shows detailed info about each MySQL query, how long it took to respond, which function called it, were there any duplicate queries etc.
Plugin shows slow queries so you can pay attention to them. This is useful for plugin and theme developers as well. Looking at these they can optimize database queries used in their theme/plugin products. Their customers can benefit by having a faster website.
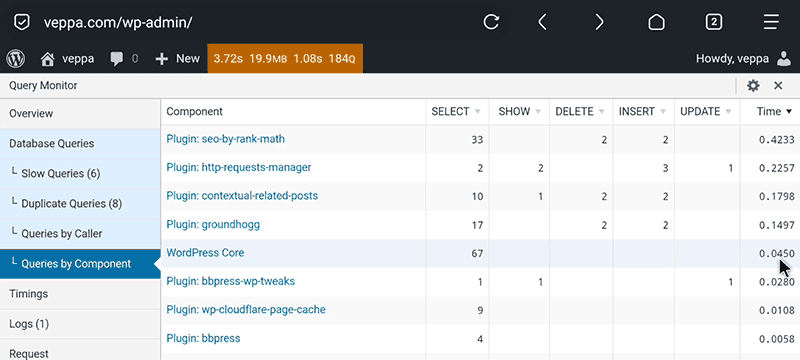
MySQL database queries are grouped by plugins and WordPress core with time taken to get response. This can be used to identify slow plugins or plugins heavily using database queries. Which can be solved by reducing data size or switching to lighter alternative plugins when possible.
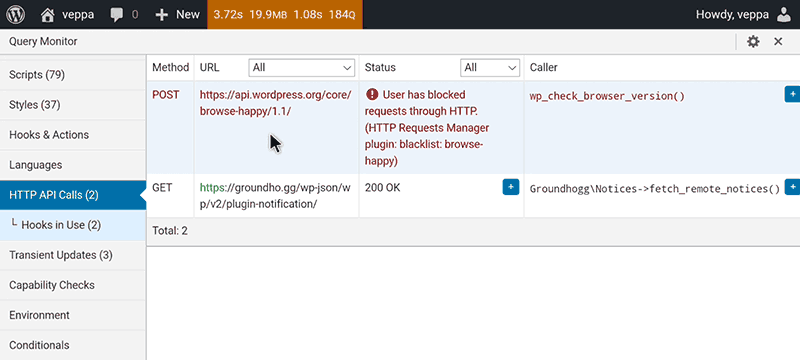
As mentioned earlier Query Monitor shows WP_HTTP external request usage on the active page. You can view response code or error messages related to each request. Plugin and related functions making each external request are also visible.
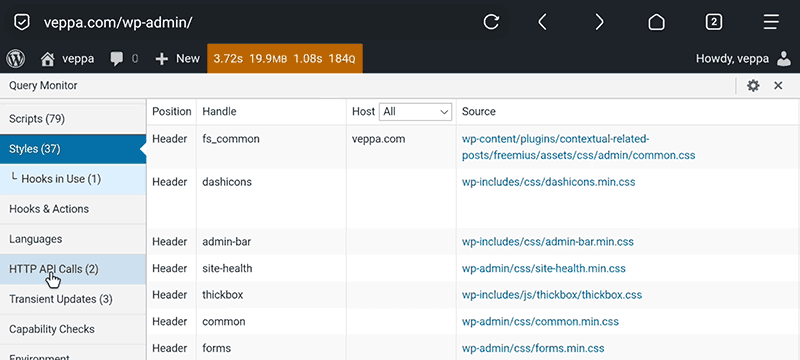
Query monitor shows page related assets (js, css) and theme template files. This is helpful for theme developers and users who want to optimize page requests.
Query monitor plugin covers all aspects of WordPress resource usage. This is very helpful for building efficient and powerful WordPress websites.
HTTP Requests Manager Features
Now let’s look at HTTP Requests Manager features.
Main feature of the HTTP Requests Manager plugin is to record all WP_HTTP external requests on all pages. Recorded requests listed on the main page of plugin.
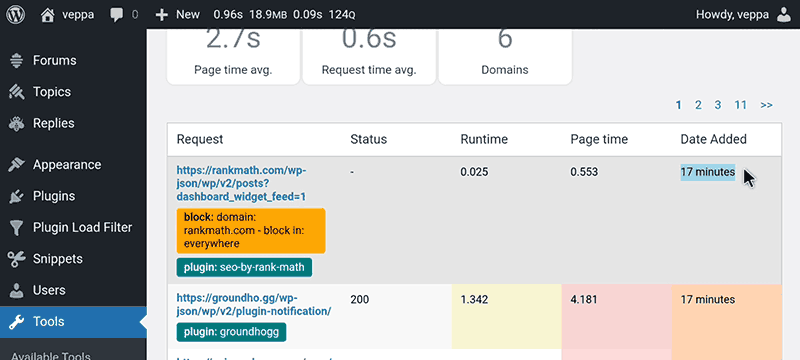
Navigate to “Tools” → “HTTP Requests Manager” page to view recorded external requests. Response status, request runtime, total page time, related plugin, request URL is visible in table view.
You can easily identify slow or failed requests on this page.
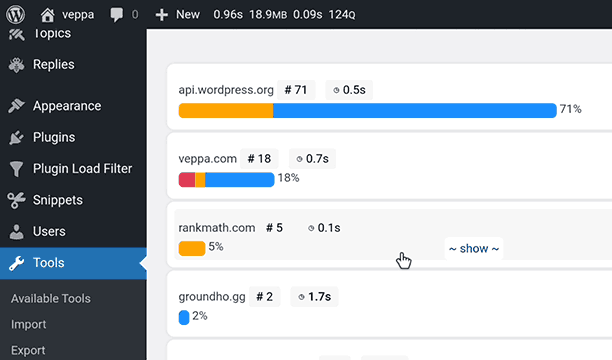
There is a group viewing feature which helps to view requests in easy to debug format. In this view external requests are grouped by request domain. You can easily identify plugin related domains like rankmath and grounhogg from this view. (See screenshot above).
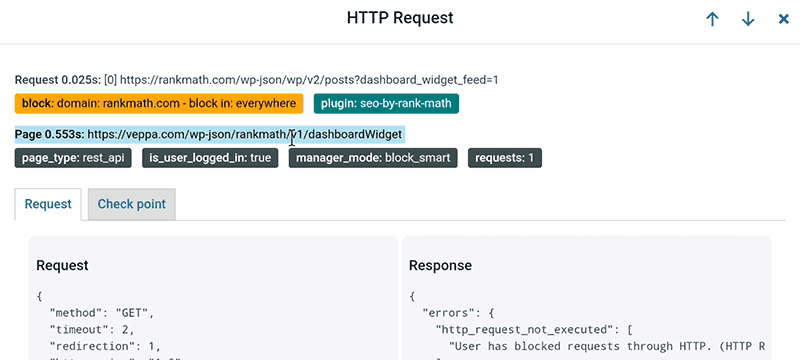
By clicking an individual WP_HTTP external request will open a popup window with more details about that request. You can view the page on which this request performed, total page time, request URL, request time, related plugin, user login status, page type, total count of requests on given page, request that is sent to external server and returned response data.
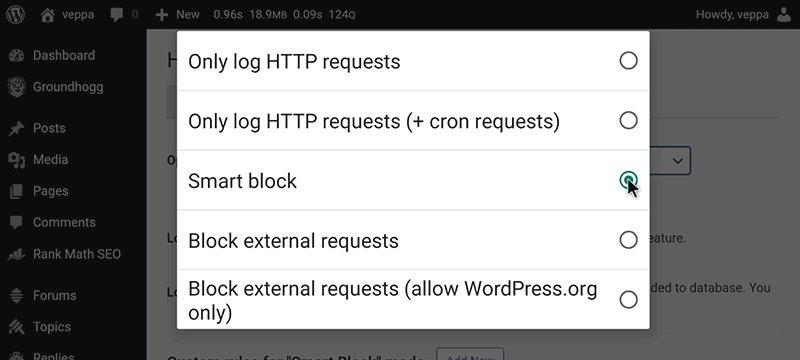
In addition to the debugging feature HTTP Requests Manager plugin has optimization as well. WP_HTTP usage optimization can be enabled by selecting “Smart block” operation mode from the “Settings” tab.
Logging all WP_HTTP requests will continue to work in “Smart block” mode. This mode blocks external requests on slow pages to keep WordPress fast for all pages as possible.
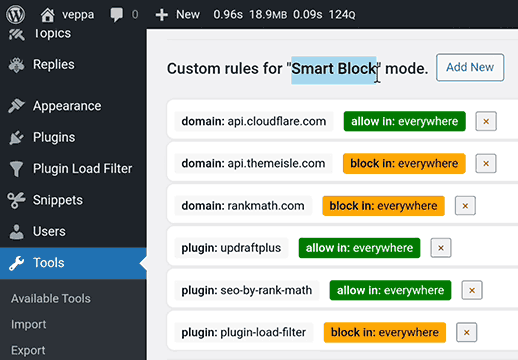
In addition to “Smart block” optimization you can fine tune WP_HTTP usage by custom rules to block useless requests and always allow important ones.
Nice feature of HTTP Requests manager is to be able to debug all external requests happening all the time inside WordPress website. You can log in any time and view historical data recorded a couple hours ago, yesterday or a week ago.
Which plugin to choose?
Choose Query Monitor:
- View all components of WordPress website to find problematic areas in database queries, WP_HTTP usage, PHP errors, memory and time usage for whole page and database queries.
- Instantly start debugging any WordPress website.
- Identify slow plugins or WordPress core features.
Choose HTTP Requests Manager:
- Record WP_HTTP usage on all pages including cron pages.
- Debug over time collected data.
- Learn which plugins intensively use WP_HTTP external requests.
- View which information sent to external domains from your WordPress website.
- Optimize WP_HTTP usage in order to keep WordPress fast. Block external requests on slow pages. Reduce page timeout errors.
- Faster admin and login pages.
Conclusion
Both plugins are good for debugging WordPress websites. There are some similarities between them but in general they are totally different.
Query monitor debugs all components inside WordPress as you view. HTTP Requests Manager focuses on debugging only WP_HTTP external request usage on all pages inside WordPress.
These plugins cannot replace each other. They can complement each other by providing more information for debugging.
Plugins do not conflict with each other and can be used at the same time inside WordPress website.
Additionally HTTP Requests Manager can be used to speed up WordPress websites. It blocks some WP_HTTP requests across all page types like admin, frontend, cron etc.
What is next:
- View how “Smart block” operation mode optimizes WP_HTTP usage.
- View debugging case studies performed using HTTP Requests Manager.
- Get Query Monitor plugin from WordPress repository.
- Get HTTP Requests Manager plugin from official page.