When you have a slow wordpress website you start wondering which plugin or action (hook) is responsible for that slowness. Learn more about memory and time usage for pages containing WP_HTTP requests.
HTTP Requests Manager plugin has a feature that records time and memory usage at certain checkpoints.
This tutorial shows how to use checkpoint records to identify actions that caused excess time and memory usage.
Check WP_HTTP playlist for more tutorials.
What can you learn from checkpoints in the HTTP Requests Manager plugin?
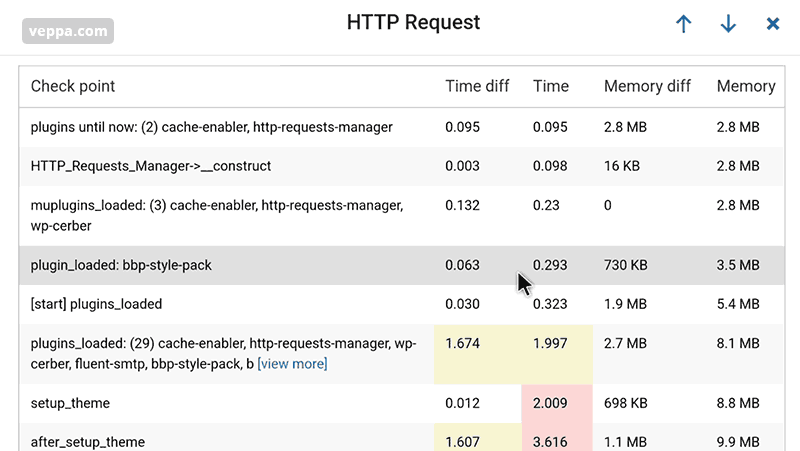
Plugin records time and memory usage on pages where WP_HTTP requests are performed. It records it to provide more information at what stage request was made, how many requests were made in total etc.
Here is what is recorder for pages on each checkpoint:
- When the plugin loads, how much time and memory is used.
- Shows time and memory difference between each step.
- Records time and memory usage on common hooks (plugins_loaded, init, wp_loaded, setup_theme, shutdown etc.). Some records are made on the start and end of the hook.
- Time and memory usage before and after wp_http request.
Reporting is useful to view general resource usage without much details.
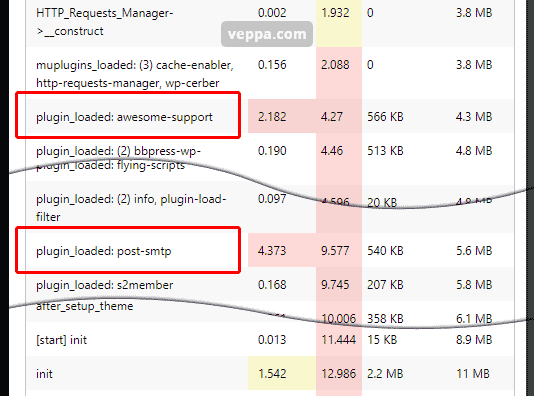
Here is another report which shows that 2 plugins were loading very slow. In this particular report login page was generated in 13 seconds. They are not always slow but just on this particular page and on this particular time. Which means there might be some slow operation happening periodically like once a day or once per month etc.
Additionally you can use the browser on page search feature to count certain records. For example count number of requests, number of requests to a certain domain, requests by file extension.
That is exactly how I counted 830 requests on the cron page when testing pingbacks.
Reporting limitations
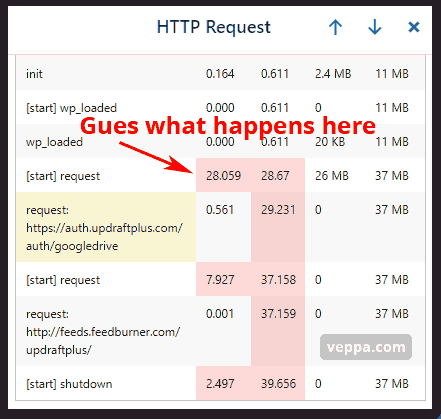
Sometimes you need to guess why some checkpoints took too much time and memory usage.
In the screenshot above we can guess that the UpdraftPlus plugin took backup (database or files) for 28 seconds and used 26 MB additional memory.
You see how we are unsure about what backup it created. Database or backup of WordPress files.
Let’s see what checkpoints cannot show you.
- Hooks does not report which plugins responsible for resource usage. At any hook multiple plugins may be using resources.
- Report does not show resource usage breakdown by plugins function, class or file.
- It does not record database usage.
- Not all pages recorded. Checkpoints recorded only on pages that had WP_HTTP requests. So you will not know what happens on slow pages that do not have any WP_HTTP request.
To get more debug info you can try Query Monitor or Code Profiler plugins. They also have limitations. They cannot catch random slowness that happens occasionally.
Conclusion
HTTP Requests Manager shows some information about time and memory usage for pages containing WP_HTTP requests. That is because it is not designed as full performance profiling software.
You still can get some valuable information out of these reports via checkpoints. You will also know when (after which hook) external requests are performed.
Please check your slow pages with checkpoints as described in this tutorial and let me know if you was able to find some helpful insights there.
What is next:
- Apart from debugging time and memory usage in a single page via checkpoints you can debug WP_HTTP requests. Identify excess WP_HTTP usage, slow requests, slow pages.
- Debug other aspects of WordPress website using Query Monitor. Compare Query Monitor to HTTP Requests Manager plugin.
- See how the plugin optimizes WP_HTTP usage which improves page generation time.
- Learn more about HTTP Requests Manager plugin.