WP_HTTP is WordPress functionality used for sending and getting information from the internet. It is used to communicate with itself or other websites. Most common use is starting cron jobs, getting WordPress updates, installing plugins from repositories, checking site health, and sending pingbacks.
WordPress plugins use WP_HTTP to communicate with external services. It can be used by plugins for creating backups on google drive, creating encrypted PayPal buttons for ecommerce sites, sending emails using external providers via API, loading search console data to WordPress, get Google analytics data, send command to purge cache from CDN, send image for compression on external servers etc.
There are so many functionalities that rely on WP_HTTP.
By effectively debugging WP_HTTP requests, you can ensure your WordPress site stays connected, up-to-date, and delivers a smooth user experience without sacrificing performance.
WordPress does not have a built in feature to identify or debug WP_HTTP requests. Thankfully plugins can be used to address this shortcoming and provide helpful tools for debugging.
WP_HTTP requests also known as API calls or External Requests.
Table of Contents
How to debug WP_HTTP requests?
There is a free WordPress plugin called HTTP Requests Manager. Which is programmed to debug WP_HTTP requests.
It is a lightweight plugin that records WP_HTTP requests. (view WP_HTTP class in WordPress.org)
Using this plugin you will get answers to the following concerns:
- How heavily WP_HTTP requests are used?
- Are there any connection errors?
- Which plugins send remote requests?
- Are remote requests slowing down your website?
Plugin records all WP_HTTP requests happening on any page. Which is not possible with another popular plugin like Query Monitor.
Requests inside frontend, admin area, cron jobs, ajax calls, login page, xmlrpc and rest_api will be recorded.
To start debugging WordPress website follow these steps:
- Install and activate “HTTP Request Manager” from “Plugins” → “Add new plugin” page.
- Navigate to “Tools” → “HTTP Requests Manager” page and check that it works and records some WP_HTTP requests.
- Wait a couple days while the plugin collects more requests.
- Check again “HTTP Requests Manager” page to see recorded data.
- For easy debugging group requests by: domain, plugin, response status, page.
- Click on request to view more info about it. You can view sent and received data in a popup. Backtrace of functions initiating request, checkpoint showing memory and time usage, additional requests on the same page also can be viewed there.
Additional tips:
- If you have a particular plugin that you want to debug then use that plugin in a way to trigger some WP_HTTP requests.
- Some requests may happen once monthly so you may need to wait more to collect diverse requests.
- By default the plugin will use “Smart block” mode. If you do not want to block any important requests at this stage and do not want any optimization then switch to “Only Log HTTP Requests” operation mode.
Now let’s look at how to debug WP_HTTP for errors and for performance optimization.
Debug WP_HTTP errors
Video tutorial to view WP_HTTP API call errors.
Watch video tutorial on YouTube.
More WP_HTTP optimization videos can be found in Youtube playlist.
To debug WP_HTTP request errors:
- From the plugin page click on the select box and choose the “Group by response” option.
- Click on the “error” group to expand it.
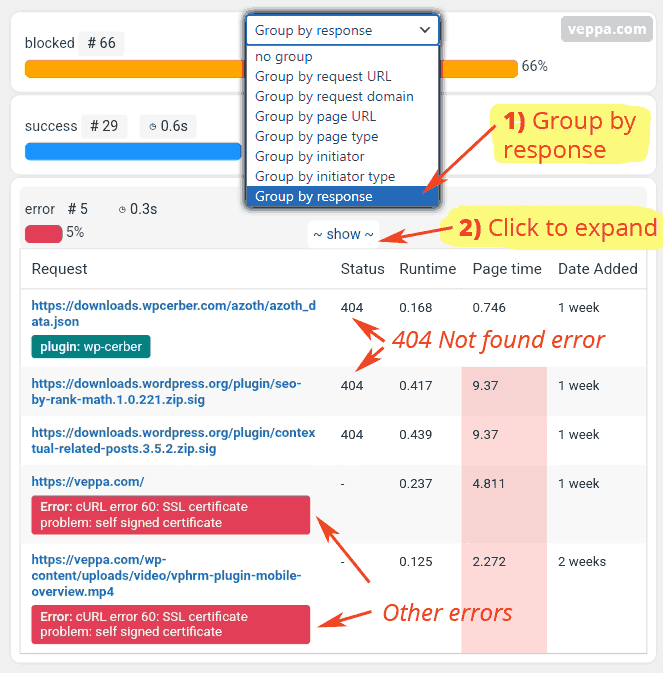
“Error” group will be populated only if the given report page has errors. If there are no errors then navigate other pages using pagination links at the top and bottom.
From here you can see requests with “Status” 404 are errors. Meaning there is no such file on the remote server.
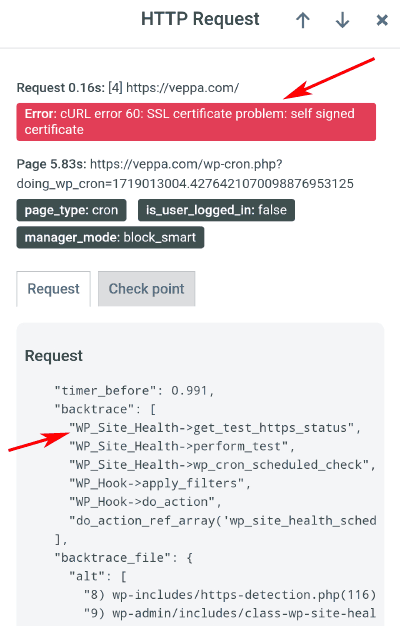
You will also see red boxes with error messages. In the screenshot we saw that there was an SSL error while getting content from our own server.
Pay attention to Request URLs in order to find failed important requests.
In addition to the error group you can expand the “blocked” (colored with orange bar) group.
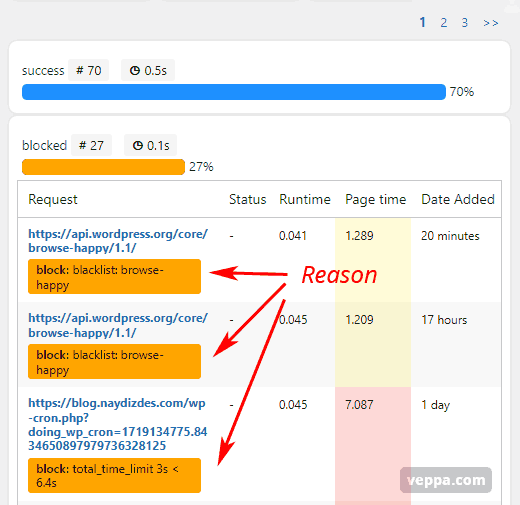
Pay attention to request URLs to make sure that “Smart block” optimization mode has not prevented any important API communication. For example connection to payment servers, backup servers, mail APIs etc.
Debug WP_HTTP for performance optimization
For debugging performance issues related to WP_HTTP you can group requests by domain or page type and look for unusual activity.
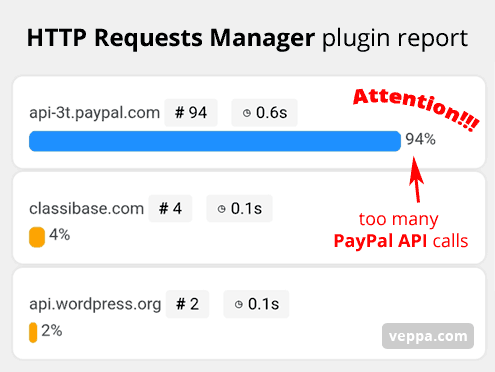
Here is “Group by request domain” shows that too many PayPal API calls are made via WP_HTTP requests. That is a warning which needs to be investigated and fixed. I explain this issue in more detail in the case study below.
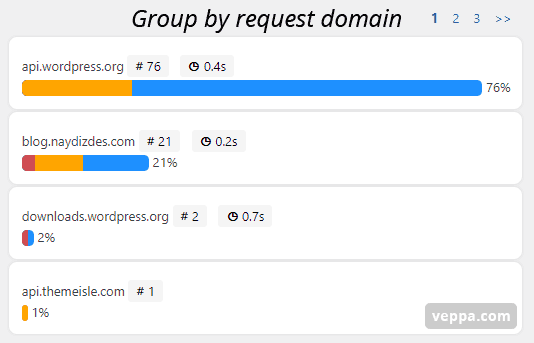
And this is normal WP_HTTP requests without any issues. Most requests are made to the WordPress API which is generally checking updates. You can expand each group by clicking on it.
With all these functionality now lets see how debugging helped us fix WP_HTTP errors and optimize WordPress performance.
WP_HTTP Debugging Case Studies
I have multiple WordPress websites and all of them have the HTTP Request Manager plugin installed for debugging and optimization of WP_HTTP requests.
I use it to fix WP_HTTP related performance issues as well as monitor and make sure that each WordPress website works without problem.
Here I want to list most WP_HTTP related problems with solutions that I encounter on WordPress websites. Also I want to share a solution here so that others can use it for fixing WP_HTTP related issues.
Case Study 1: Too many PayPal API calls. 94% of all WP_HTTP requests.
Problem:
The HTTP Requests Manager report showed that 94% of all recent requests were made to PayPal API. Viewing details we can see that request done on frontend Pricing page via s2Member plugin. 2 remote requests were sent to PayPal servers to get encrypted button code. WordPress Caching was present but ineffective.
Solution:
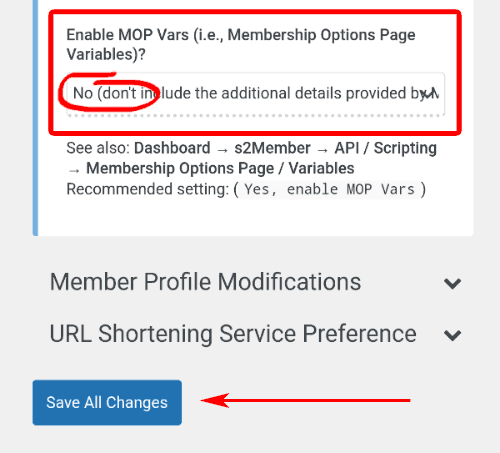
- Step1: Remove custom URL variables — We need to use a single Pricing page URL without any additional custom variables. Checking the s2Member plugin setting we found that disabling MOP vars will remove custom variables from the Pricing page. Now the Pricing page can be cached and served for all requests from cache. This will reduce PayPal API usage to normal. Maybe it will reach up to 5% of all WP_HTTP requests. Which is around 20x improvement.
- Step 2: Use static HTML button code — With the above approach there is one caveat. While we removed custom MOP vars from our existing website. Web spiders for many years have indexed thousands of
/pricing/page URLs with MOP vars. They will continue to check those not optimized URLs for several months or years. To fix this we can optimize further and use a static HTML purchase button that will load separate page with real PayPal button when clicked. This way we will have a fast pricing page without any API calls.
Read the full case study and tutorial here.
Result:
After optimization we do not have any PayPal API calls. Payment page uses encrypted static PayPal buttons. Payment page is functional and fast.
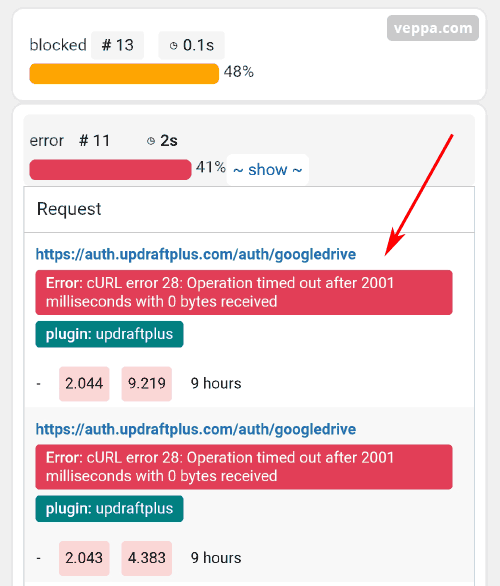
Case Study 2: WP_HTTP timeout error prevents sending WordPress backups to Google Drive
Problem:
Connection timeout to Updraft server getting token then storing website backup to Google Drive. Backup is not uploaded to Google Drive.
Updraft plugin takes backup of your WordPress website and stores on local machines as well as in remote servers. I prefer to store backups on Google drive. Plugin automatically takes weekly/monthly backups. Then send it to google drive. While one of those backup operations took place I noticed a connection error (reported in HTTP Requests Manager plugin) to the Updraft server for getting a token for Google Drive via WP_HTTP.
I use the HTTP Requests Manager plugin to monitor WP_HTTP usage for debugging and optimization.
Connection to the Updraft server was not completed due to request timeout. Which is reduced to 2 seconds by the same “HTTP Requests Manager” plugin in “Smart block” optimization mode.
So the plugin sometimes limits important requests while optimizing WP_HTTP usage.
Solution:
Ideal solution will be using HTTP Request Manager that has custom rules feature. There you can define a new rule to allow all requests to auth.updraftplus.com domain for getting a token without timing out.
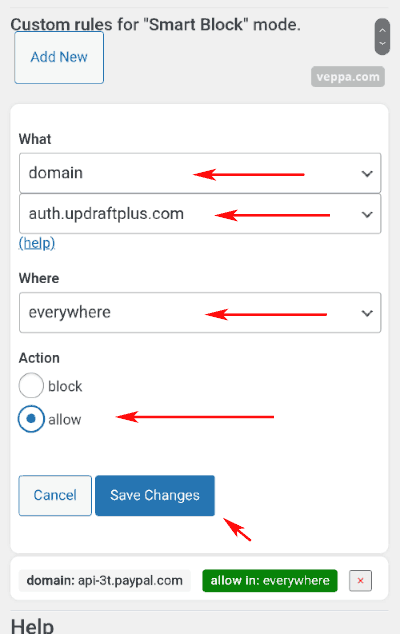
Explicitly allowed rules will not be blocked or limited by short timeouts. Your important remote requests to the API will work as expected.
You can create an Allow rule for a plugin or domain if you want.
Check how to add custom rule to always allow remote request for certain plugins.
Result:
Sending WordPress backups to Google Drive by Updraft plugin was restored.
Case Study 3: SSL certificate problem
Problem:
WordPress site health feature will check if your website works correctly over HTTPS.
Solution:
Do not rely solely on Site Health reports. Check if the site is loaded over https using your web browser.
![]()
In my case the site is behind Cloudflare CDN servers. So SSL certificate is provided by Cloudflare. WordPress Site Health is checking itself using local DNS without going through Cloudflare. For this reason there is only a self signed SSL certificate when accessed from the same server.
You can safely ignore this warning as we can see that SSL certificate is working when accessed via browser.
Case Study 4: Too many enclosure checks via WP_HTTP
Problem:
When we publish a post WordPress checks all URLs inside the post (links, image sources etc.) for detecting the existence of video and audio files. When found it adds them to the database. Some plugins or themes may use it to format related media files inside content.
But generally 99% of time all those URLs are to web pages and image files. Checking file type of each link to webpage and image via WP_HTTP is a waste of server resources.
Post having 20 internal links and 30 images will make 50 WP_HTTP requests each time you click save button on that post. Those 50 requests can take more than 60 seconds to complete.
Additionally when you check 20 internal pages your own WordPress website has to generate those pages. Which will keep your server busy while generating those pages. 20 pages when it takes 2 seconds to generate will take 40 seconds of your server CPU for providing data to the useless feature “enclosure checks”.
Solution:
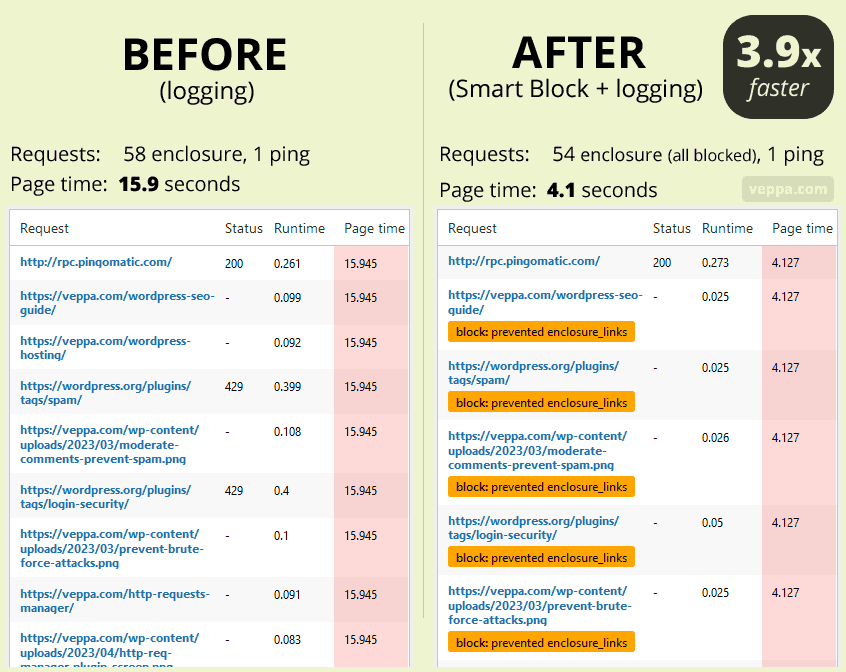
Disable enclosure checks with “Smart block” operation mode in HTTP Requests Manager plugin for WordPress.
You can see performance gain from the screenshot above.
Result:
Debugging use of enclosure checks helped us to add functionality of preventing enclosure checks to HTTP Request Manager plugin. This way all WordPress users can optimize their website with “Smart block” mode.
Learn more about optimizing enclosure checks.
Case Study 5: Too many Pingbacks sent via WP_HTTP
Problem:
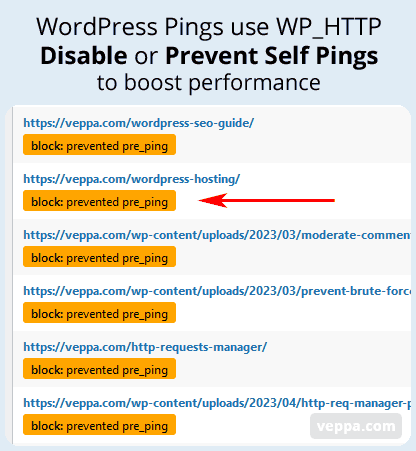
When post saved WordPress sends pingback to all URLs mentioned in post content. This leads to too many useless WP_HTTP request usage. Once useful, old features are not used any more by blogs.
Solution:
- Suggested definitive solution: Disable pingbacks completely from WordPress settings
- Alternative limited solution: Use “Smart block” mode in HTTP Requests Manager to prevent self-pingbacks.
View detailed instructions to disable all pingbacks.
Result:
Faster WordPress website, no pingback spam and preserving server resources for more important tasks.
Case Study 6: Explicitly block unwanted requests
Problem:
Some plugins and themes may send/request additional information communicating to their own website via WP_HTTP. You do not want to get news, additional promoted features, news, ads etc to be loaded and shown inside your WordPress admin area.
Solution:
If you are not using any features relying on remote communication then it is safe to block those requests.
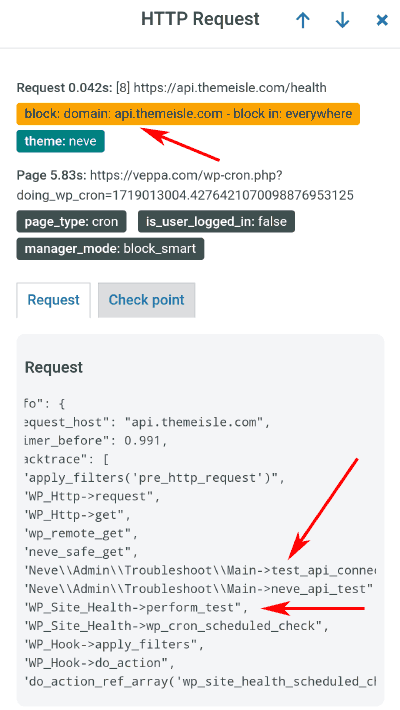
In the above screenshot we can see that Neve theme tries to connect to their API. But I am not using any features of the theme that rely on API. For this reason I will explicitly block those connections.
While debugging you will notice that API connection is checked as part of WordPress Site Health check. So Neve theme wants to make sure that connection will work when needed.
Explicitly block any plugin, theme, domain communication using “Custom Rules” inside HTTP Requests Manager.
Important to make sure that you are blocking only the not important functionality provided by the plugin or theme.
Result:
WordPress performance optimized without needless loading of ads, offers, news, unused features into your admin area.
Learn how to block individual WP_HTTP requests.
Case Study 7: Connection timeout error
Problem:
Extremely slow WordPress admin that takes 10-30 seconds to load. Most admins complain about it and don’t know what is causing this problem.
Generally admin page takes too long to load, up to 30 seconds, on “dashboard” or the “Plugins” → “Add New Plugin” page. Then you get an error instead of a list of plugins from the WordPress repository.
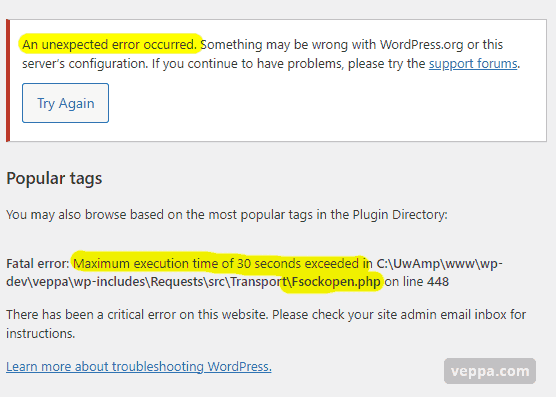
You will see the Fsockopen connection error shown above.
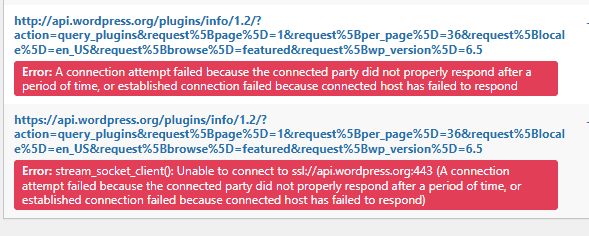
This is how the error shows in HTTP Requests Manager plugin debug log.
It has more details that says:
Error: stream_socket_client(): Unable to connect to ssl://api.wordpress.org:443 (A connection attempt failed because the connected party did not properly respond after a period of time, or established connection failed because connected host has failed to respond)
This means that your server has a problem connecting to WordPress server.
Solution for live websites:
For live websites, tell this error to your web hosting support team. They need to make sure that your WordPress website can connect to WordPress.org repository without problem.
Additionally if you still need to work on your website regardless of this connection error then you can temporarily disable external requests. Next section explains how to block it.
Solution for localhost (development, staging) websites:
When you are working on a development server like localhost or staging without internet connection then this is expected behavior.
You know that you are working offline and your problem is slow pages when navigating development websites.
You can speed up pages by disabling all external communication using HTTP Requests Manager Plugin. Select “Operation mode” → “Block external requests” from the plugin “Settings” tab.
As a result you will get much faster page load times without external connections on development websites. Pages will be generated in 1 second instead of 30 seconds.
Check tutorial for blocking all external requests.
Case Study 8: Connection refused
Problem:
WordPress does not get updates. You know that there is a new version of wordpress but your website does not show it.
Additionally when you navigate to “Plugins” → “Add New Plugin” page you will see an error message.
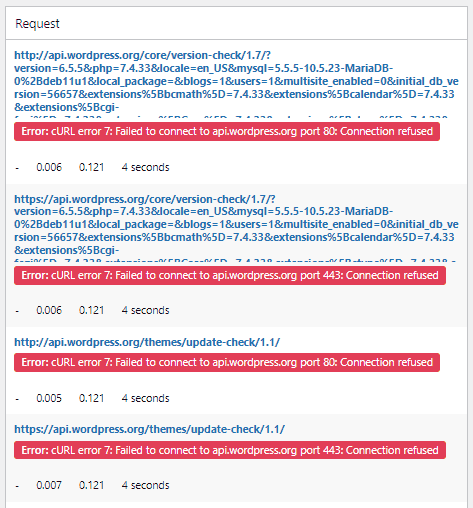
When you check WP_HTTP error it shows as “Error: cURL error 7: Failed to connect to api.wordpress.org port 80: Connection refused”.
Solution:
This means that there is a network problem between your wordpress website and api.wordpress.org domain. Contact your web hosting and tell them about this problem.
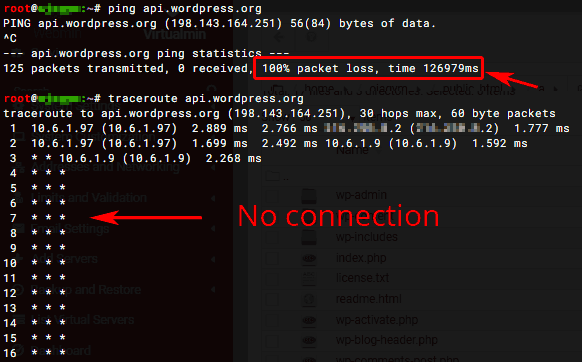
Alternatively you can double check the problem to make sure that it is a network error if you have SSH access to your hosting then run ping and traceroute commands.
ping api.wordpress.org
traceroute api.wordpress.org
Your web hosting will fix this problem. It is related to their network. You cannot fix it yourself. If your hosting cannot solve it then move to other web hosting that better supports WordPress websites.
Result:
You identify that “connection refused” problem is related to the network. After it is fixed by your web hosting you will get the latest wordpress updates without problem.
Access to the plugin repository will also be restored.
Case Study 9: Too many translation API calls on WordPress login page
Problem:
When you set up WordPress in different languages a select box will appear on the login page. If you have that language switch then WordPress checks for the latest translations every 3 hours (8 times per day). (reference)
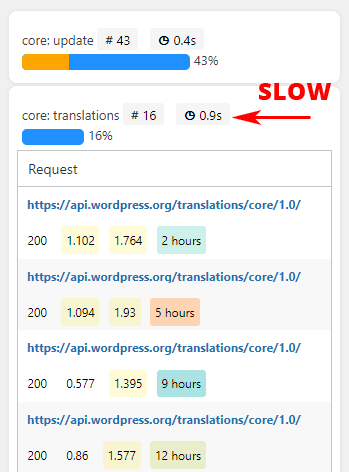
Each translation API call (WP_HTTP external request) takes about 1 second. Which slows down the login page.
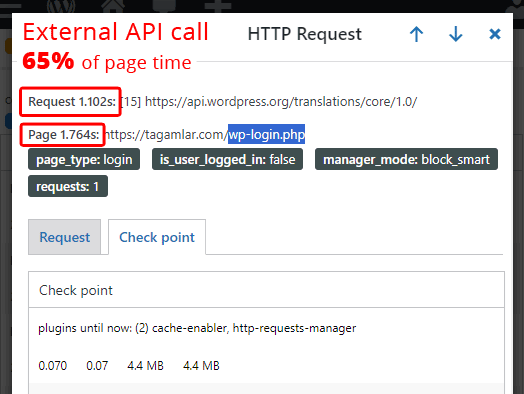
Screenshot shows how WordPress translation API added 1.1 second to total page generation time.
Total page time raised to 1.7 seconds because of the Translation API call.
Solution:
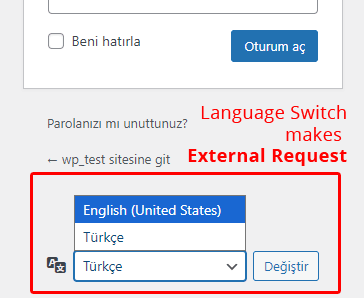
Generally WordPress will show US English and another locale in the select box on the login page.
That language switch initiates an external request to the Translation API.
Disable language switch to prevent an external request.
Way 1:
You can disable the language switch by using a plugin called “Disable Login Language Selector”.
Way 2:
If you are already using the “Code snippets” plugin then use the following snippet to disable language switching on the login page.
add_filter( 'login_display_language_dropdown', '__return_false' );
Way 3:
If you no longer want WordPress in another language. Completely delete the /wp-content/languages/ folder. This will switch wordpress back to US English.
Result:
WordPress login page will not make external requests to the translation API and will load much faster.
Do not worry about getting the latest translations. Translations will be checked when you visit “Settings” → “General” inside the WordPress admin area.
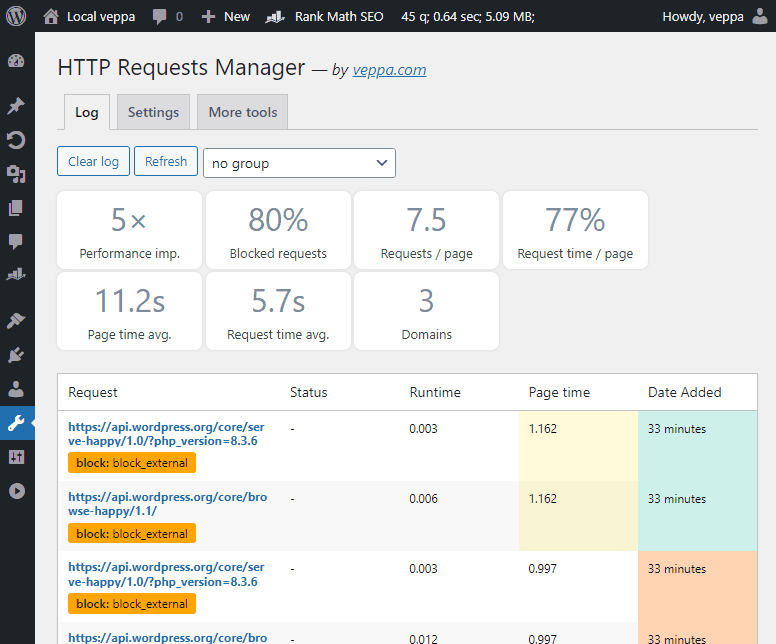
Case Study 10: Too many API calls by Rank Math plugin
Problem:
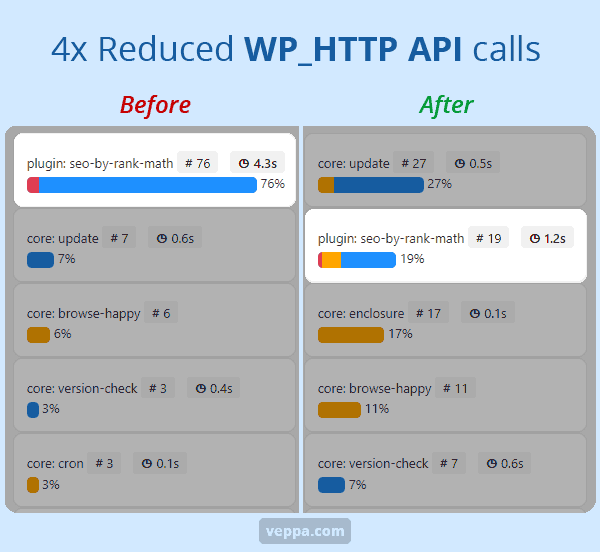
Rank Math SEO plugin had too many API calls counting for 76% or all latest WP_HTTP external requests. API calls are made when the Rank Math plugin is connected to Google Search Console.
Solution:
Reduce external requests (API calls) initiated by Rank Math by disabling unused features.
In this case I disabled API calls made to Index Status API. This can be done by disabling Index Status report in Rank Math plugin settings.
Result:
Disabling unused feature reduced total number of API calls made by Rank Math plugin by four times. From 76% to 19%. This prevented waste of server resources and improved overall performance of the WordPress website.
View detailed tutorial to reduce Rank Math API calls.
Case Study 11: Too many WP_HTTP requests due to Database Error
Problem:
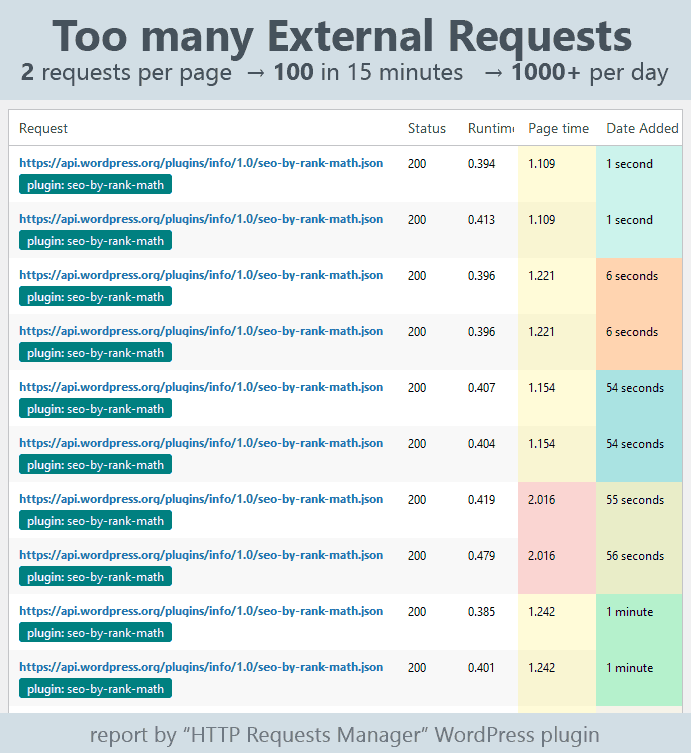
Noticed too many WP_HTTP external requests to the same URL by same plugin. 2 requests per page, 100 requests per 15 minutes and more than 1000 requests within one day.
2 WP_HTTP requests per page add 1 second to page generation time. This one second was constantly added on every page on my website.
Solution:
After checking back trace, related plugin code and database table noticed that response from external request is not saved to database due to charset and collation error.
Table and related fields were using utf8 charset but data was in utf8mb4 format. Utf8mb4 supports up to 4-byte Unicode characters which contains more emoji icons.
When 4-byte data sent to 3-byte database table field no data was written and no error displayed.
To fix problem converted all database tables and fields using old utf8 charset to utf8mb4 charset.
Result:
Excess external requests disappeared. Page generation time reduced to normal pre-error state. Data written to database properly without any error.
View detailed tutorial with MySQL query code to fix database table charset.
My process for debugging WP_HTTP requests
My process is very simple. I do not obsessively look for WP_HTTP errors or optimization.
I just once in a while (week, month) look into a report generated by the HTTP Requests Manager plugin.
Most of the time everything is ok without much difference.
But when I see some anomalies then I pay attention and learn more about the problem by clicking on related WP_HTTP requests. If it is a plugin related issue then look into plugin behavior and settings. Try to understand why this error or anomaly happens.
I will double check to make sure if this is a really important error. When error is not important I will not do anything.
Then I look for a solution within the plugin or WordPress settings. Mostly changing one checkbox or setting will solve the WP_HTTP problem. Like in case study related to encrypted PayPal buttons or disabling pingbacks.
When there is no solution in settings then I apply “Custom rule” either to allow or block requests in question.
FAQ
How do I identify if my issue is related to WP_HTTP requests?
Sometimes WordPress can show some error messages related to WP_HTTP requests. But they are too general and you will not know for sure if it is related to WP_HTTP. Additionally WordPress can show errors only on visible pages. You will not get any error on cron or ajax pages.
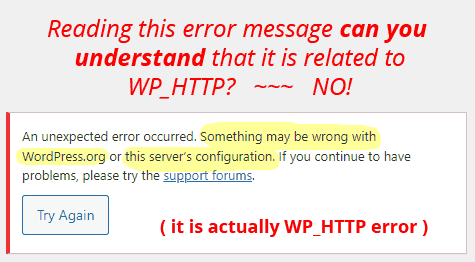
– Can you understand the above error message related to WP_HTTP?
– No.
WordPress does not have a built-in feature to monitor WP_HTTP requests. You need to use plugins for viewing and debugging WP_HTTP errors.
Use HTTP Requests Manager plugin to log all WP_HTTP requests for debugging. It will record and group requests that had some sort of error in them.
You can even debug requests performed inside cron jobs which are not visible in the web browser.
Check this error message reported by the plugin.
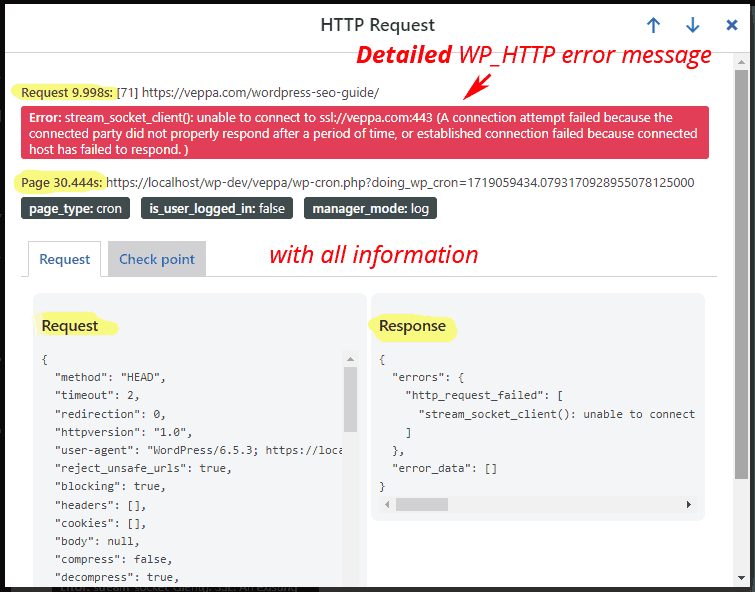
When you find a logged WP_HTTP error you can click on it and see the related plugin and page from which request was made. Additionally you will see an error message with a short description.
All this information will help you to understand and fix errors as fast as possible.
How can I capture and analyze raw HTTP request and response data for WP_HTTP calls?
HTTP Requests Manager plugin records WP_HTTP requests. Click on the request that you want to view data. On the opened window you will see a field containing request and response data.
Too big responses will be trimmed in order to keep the log viewing interface fast and responsive.
Check the screenshot above that displays raw WP_HTTP request and response data.
What are some common symptoms of WP_HTTP request problems?
Common symptoms are:
- Request timeout.
- File not found on remote server.
- SSL certificate problem.
Do I need to enable debug mode in the WordPress config file for debugging WP_HTTP?
No. With the HTTP request Manager plugin you can debug without enabling debug mode. It is designed to work on a live website without using WP_DEBUG constant in the config file.
It does not throw error messages to website visitors or site admin. Instead it logs all requests and then admin can view them in the “Tools” → “HTTP Requests Manager” page. From there you can look for requests with errors. Click on them to view more information and then use it for debugging.
Can I view WP_HTTP errors in WordPress debug mode without any plugin?
No. WordPress debug mode with WP_DEBUG constant does not reveal any additional information related to WP_HTTP request errors.
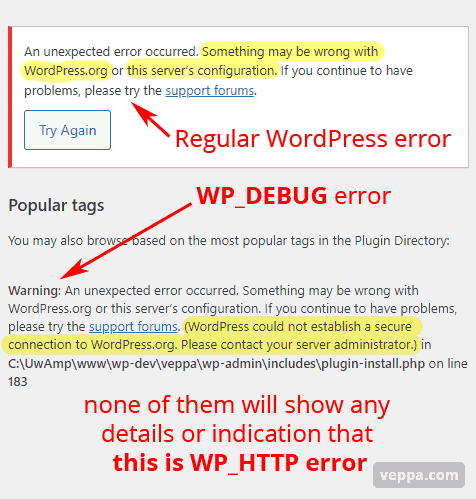
Check this screenshot with enabled WP_DEBUG constant.
- There is not much indication that this is a WP_HTTP problem.
- Not any detail about WP_HTTP request or response.
- When WP_HTTP error occurs in cron job or ajax call then you will not see any “Warning” message. you Will not notice that there were some WP_HTTP errors.
For these reasons you cannot debug WP_HTTP requests without a plugin only by defining WP_DEBUG constant.
Conclusion
Check every error and make sure that your website functionality is not broken. Some errors can be ignored while others can break your website.
I have explained how to record and debug WP_HTTP requests. Find errors, discover more details, pinpoint the related plugin and page then fix those errors.
Additionally you can monitor logs and auto fix WP_HTTP related performance issues.
I have discovered and fixed all related issues on my websites thanks to the HTTP requests manager plugin. I documented some of those fixes in case studies that are shared in this article.
If plugin helped you to identify and fix WP_HTTP related issues then please share your experience in comments.
Use HTTP Request Manager to debug and optimize WP_HTTP requests of your WordPress website.
What is next?
- View more debug info via Checkpoints tab.
- Other aspects of debugging WordPress in comparison Query Monitor vs. HTTP Requests Manager.
- Learn more & download HTTP Request Manager plugin.